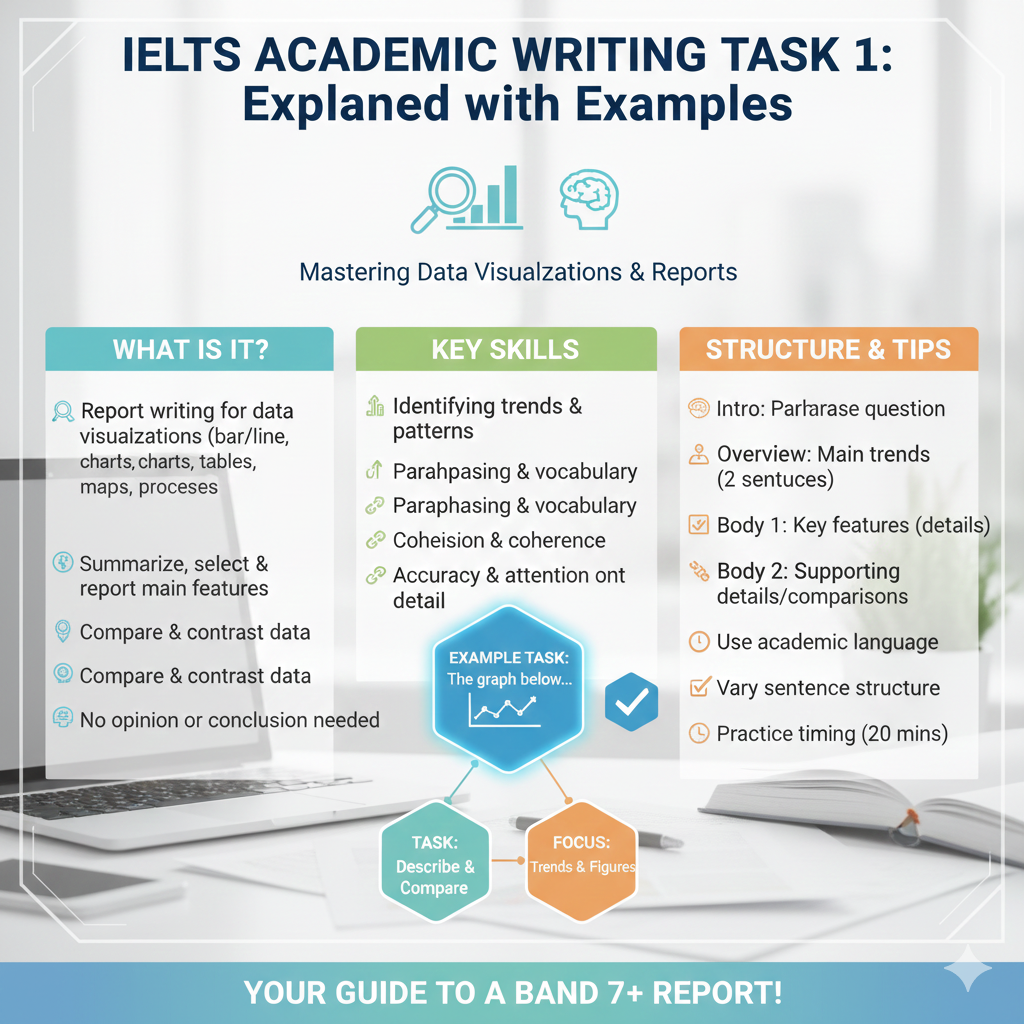
Task 1 of the IELTS Academic Writing test requires you to describe visual data objectively. Your goal is not to give opinions, but to report the main features, make comparisons, and highlight key information.
What You’ll See: The 7 Visual Types
- Line Graphs: Show trends over time.
- Bar Charts: Compare categories or trends over time.
- Pie Charts: Show proportions of a whole.
- Tables: Present exact figures and data sets for comparison.
- Diagrams (Processes): Describe a natural or industrial process.
- Diagrams (Maps): Describe changes to a location over time or compare two maps.
- Multiple Sources: A combination of two different charts (e.g., a line graph and a table).
The Perfect Task 1 Structure (4 Paragraphs)
A clear structure is non-negotiable for a high score.
- Introduction (Paragraph 1): Paraphrase the question. State what the visual shows, including the time period and units of measurement (e.g., kilograms, millions of people, percentages).
- Overview (Paragraph 2): This is the most important paragraph. Summarise the main trend or most significant feature without citing specific data. What is the overall story the graph tells?
- Details Paragraph 1 (Paragraph 3): Support your overview with specific data. Select key figures, make comparisons, and group similar data together.
- Details Paragraph 2 (Paragraph 4): Provide a second set of detailed data to further support your overview.
Essential Vocabulary for Task 1
- Trend Language:
- Upward Trend: Increase, rise, grow, climb, surge.
- Downward Trend: Decrease, fall, drop, decline, plunge.
- Stability: Remain stable, level off, stabilize, plateau.
- Fluctuation: Fluctuate, oscillate, vary.
- Adverbs & Adjectives: Sharp/sharply, significant/significantly, steady/steadily, slight/slightly, gradual/gradually.
- Approximation: Approximately, about, around, just over, just under.
- Comparison Language: Similarly, likewise, in contrast, whereas, while.
Task 1 Dos and Don’ts
- DO write an overview. Without it, you cannot score above Band 5 for Task Achievement.
- DO use the passive voice for describing processes (e.g., “The grapes are harvested…”).
- DO use the correct tense based on the dates in the visual.
- DON’T list every single data point. You must select and group information.
- DON’T give your opinion or reasons for the trends (e.g., “Sales increased because of a successful marketing campaign”).
- DON’T copy phrases from the question verbatim. You must paraphrase.
